How many Palestinians entered Judea, Samaria, and Gaza together with Yasser Arafat in the wake of the Oslo Accords? Many Israeli citizens are unaware that immediately after the signing of the Oslo Accords, tens of thousands of Palestinians — at the least — entered the territories. This was all without public debate of the future ramifications for the State of Israel.
In other words, most of the public does not know that the State of Israel intentionally, under an unbelievable set of assumptions, brought tens of thousands of Palestinians into Gaza, very many of them with terrorist backgrounds. Not for nothing did Faisal Husseini describe the Oslo Accords as a “Palestinian Trojan Horse” in a 2001 interview.[1] Or as he put it, “We all entered the belly of the horse, and the horse itself passed in through the walls. Now the time has come for us to say: Climb down from the belly of the horse and start your referring to was the outbreak of the Second Intifada. And we will note in passing that Faisal Husseini was considered one of the “moderates” in the Palestinian leadership.
But you will already be asking how I know that tens of thousands came in. The facts are as follows.

Official permissions under the Oslo Accords
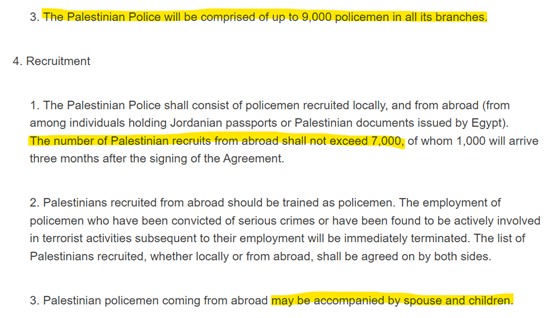
Among the series of agreements known as the Oslo Accords, the principal agreement is the Cairo Agreement of May 4, 1994. That agreement, also known as the “Gaza and Jericho First” agreement, set out the principles for Israel’s withdrawal from Gaza (and subsequently from Judea and Samaria as well) and the security arrangements to prevail from that point onward between Israel and the Palestinian Authority. In Annex I to phases of Israeli troop withdrawal and the security arrangements for the present and future, Article 3 deals with “The Palestinian Directorate of Police Force.” That article defines the structure and duties of the police. Clause 3.3.3 stipulates that the force, in all branches, will total up to 9,000 police. The next clause, 3.4.1, specifies that no more than 7,000 of the police will arrive from abroad. In other words, from the Palestinian diaspora. And immediately afterward, clause 3.4.3 provides that those arriving from abroad may be accompanied by spouses and children.

On September 28, 1995, in Washington, an additional agreement was signed, known as Oslo II or officially “The Israeli-Palestinian Interim Agreement on the West Bank and the Gaza Strip.” Once more, the first annex to the agreement addressed security arrangements.[1] Clause 4 dealt with the Palestinian police force, its structure, its duties, and the recruitment of police. Clause 4.3 stipulates that there will be no more than 30,000 police: up to 12,000 in Judea and Samaria and up to 18,000 in the Gaza Strip. And clause 4.4 once more sets a limit: No more than 12,000 members of the force will come from abroad, but they too may be accompanied by spouses and children. It is also stipulated there that of those 12,000 coming from abroad, 7,000 will be posted to the Gaza Strip and 5,000 to Judea and Samaria.
As may be gathered from Clause XIV.2 in the first section of the body of the agreement,[2] the 12,000 returnees are in addition to the 7,000 who were already covered in the Cairo Agreement. That clause stipulates: “The Palestinian police force established under the Gaza-Jericho Agreement will be fully integrated into the Palestinian Police and will be subject to the provisions of this Agreement.”[3]
Even if we consider only the numbers admitted according to those two agreements, Israel officially allowed 19,000 Palestinians, plus wives, plus children, inside the Trojan Horse. Since the recruits were relatively mature people, 30 years old and up (of which more later), it is very reasonable to suppose that an absolute majority had spouses and several children. In other words, by a very conservative estimate, and without considering that the Palestinians may have introduced more people than the agreements permitted, the people numbered at least 60,000; and apparently there were many more.

Additional evidence
A look into the history of the Palestinian security services underlines this phenomenon. For example, the book Entry-Points to Palestinian Security Sector Reform[4] relates the story of how Yasser Arafat established those security services. On page 19, it says: “Very soon after its establishment, the PA had ten different security organizations under its command: Civil Police, Civil Defence, Preventive Security, National Security Forces, Naval Police, Aerial Police, Military Liaison, Military Intelligence, Presidential Security (Force 17), and General Intelligence. Except for the Preventive Security, these organizations were mostly based on PLO military units from the Diaspora”; and on the next page: “by 1996, the PA had more than 35,000 security officers on the payroll, even though Oslo II had limited the ‘Palestinian Police Force’ to 30,000.”
Further testimony may be found in an article named “The Evolution and Reform of Palestinian Security Forces 1993–2013,”[5] which says: “Ten days after signing the Cairo Agreement, the Palestine Liberation Army (PLA) soldiers and the returnees (Al-‘aedin) started to return back to Gaza and Jericho to set up the PA’s security forces and institutions. The 1995 Oslo II increased the number of policemen to 30,000 (12,000 for the West Bank and 18,000 for Gaza); however, by then the Palestinian police force had already reached 22,000 in Gaza and Jericho alone. […] In 1998, the number of security personnel reached between 30,000 and 40,000, increasing to 50,000 by 2000, and 53,000 by 2003.”
Note that those accounts mention 53,000 members of the Palestinian security forces de facto, whereas the Oslo Accords permitted the Palestinians a maximum of 30,000.

Israel knowingly imported tens of thousands of terrorists onto its soil
Who are those people from abroad whom we inserted among ourselves to serve in the Palestinian police? They were members of the Palestine Liberation Army (PLA), 30 years old and up, who for many years had allied themselves with Arafat the arch-murderer. Many of them were living in Tunis when the Oslo Accords were signed. They reached Tunis, it will be remembered, when the State of Israel was forced to allow some 12,000 terrorists to leave Beirut in August 1982 on ships that carried them to Tunisia and other countries.[6] Most of those expelled from Beirut came to Tunis and later reunited with their families. For example, a New York Times article from 1985[7] describes a visit to one of the schools for Palestinian children in Tunis, where 445 students were enrolled. Estimate for yourself how many more people, ten years later, that number implies. Moreover, there are various accounts indicating that the mature age of the returnees and the difference in their mentality caused much friction with the Arabs of Judea, Samaria, and Gaza from before the Oslo Accords.
We stress that we have been counting only those people who returned to participate in the Palestinian police forces. Besides them, Arafat also brought many bureaucrats in. Their number is difficult to ascertain; but apparently it is more than trivial, as the following quotation indicates: “The Old Guard derives legitimacy from the PLO legacy as well as the Oslo agreement and its outcome. Its power is also derived from its control over the financial resources of the PLO and the PA, the diplomatic recognition accorded it by the international community, and the control it exercises over the main bodies and institutions of the PLO and the PA, including the bureaucracy and the security services.” [8]
A significant rise in the population according to demographic figures
Another way of examining the matter is to analyze demographic data from the relevant years.
For example, a UN report from 2012[9] provides figures on the residents of Judea, Samaria, and Gaza, including East Jerusalem.[10] In Graph 1, the two bars for the period between 1995 and 2000 show that the number of residents was increasing sharply; and the increase eased suspiciously as measured in the years 2005 and 2010.

A significant uptick is visible at the years 1995 and 2000, over and above the population’s pace of natural increase.
Source: The UN, World Population Prospects: The 2012 Revision
A similar picture emerges as well when we look at the average annual rate of change in the population as it appears later in the same report (Graph 2).

Source: The UN, World Population Prospects: The 2012 Revision Ibid, p. 142/166. The graph depicts the data as they appear in the table.
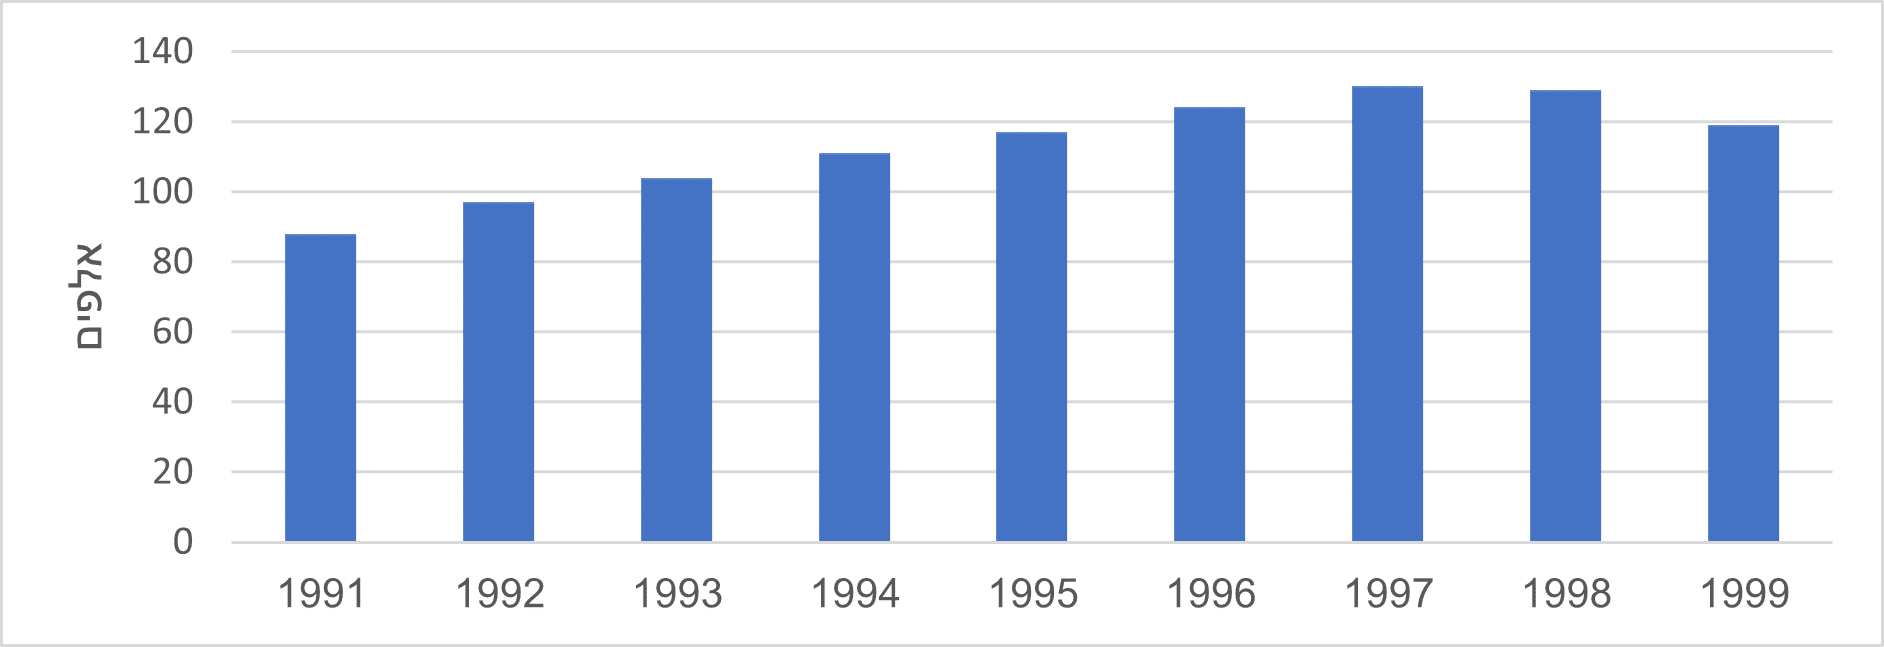
The UN report also presents annual figures interpolated for the 1990–1999 period [11].A calculation of the differences in population growth, based on those figures, appears in Graph 3. Here too, an unexplained easing of population growth visibly commences in 1998.
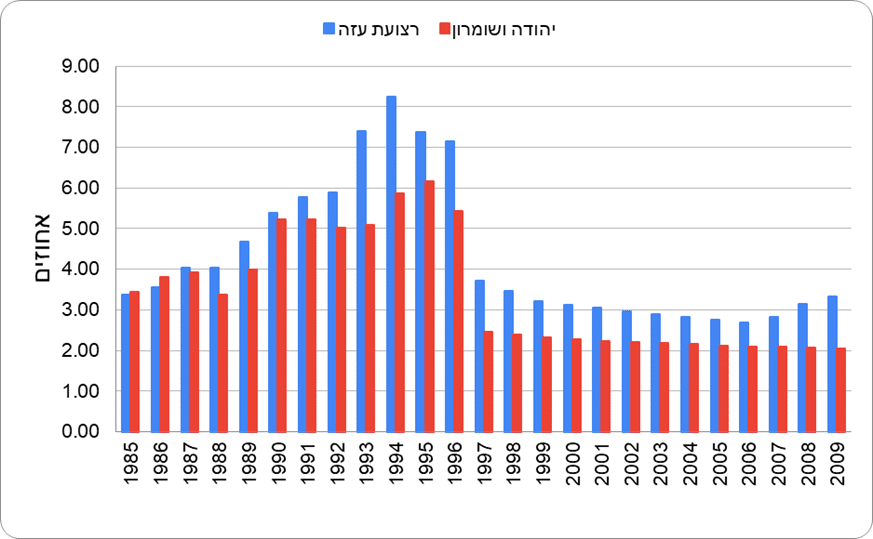
Another source of demographic data is the US Census Bureau.[12] It estimates the population by year separately for Judea & Samaria and for the Gaza Strip. Its source is the census performed by the Palestinian Central Bureau of Statistics for 1997. In these figures too, when examined (Graph 4 and Table 1 below), a sharp increase in population may be perceived between 1995 and 1997 and it eases significantly afterward.
Conclusion
In conclusion, the figures point to a relatively sharp increase, over and above natural population growth, in a short span of years immediately following the Oslo Accords. There is no explanation for such an increase, which abates after a few years, other than a massive influx of new residents into the area. In other words, the State of Israel intentionally introduced tens of thousands of Palestinians, at the least, from abroad as part of the Oslo Accords, without headlines and without outcries. It remains only to wonder why the Israeli public is unaware of the influx of such a quantity of Palestinians as part of the Accords.
This also amounts to a significant consideration for today’s discourse surrounding the contribution of the Oslo Accords to the events of October 7. Was the influx of tens of thousands of people consistent with the claim that the Oslo Accords could be reversed at will, even if they worked out badly? Could those people really have been sent back abroad? That question intensifies the need for public discussion and criticism of the political decisions that carry multi-generational implications for Israel.

Source: The UN, World Population Prospects: The 2012 Revision

Appendix
Table 1: Demographic figures for the Arab population of Judea, Samaria, and the Gaza Strip. Source: US Census Bureau
| Gaza Strip | Judea and Samaria | |||||
| Year | Population | Growth (absolute) | Growth (percent) | Year | Population | Growth (absolute) |
| 1985 | 531,778 | – | – | 1,044,073 | – | – |
| 1986 | 549,712 | 17,934 | 3.37 | 1,080,128 | 36,055 | 3.45 |
| 1987 | 569,331 | 19,619 | 3.57 | 1,121,302 | 41,174 | 3.81 |
| 1988 | 592,371 | 23,040 | 4.05 | 1,165,357 | 44,055 | 3.93 |
| 1989 | 616,317 | 23,946 | 4.04 | 1,204,700 | 39,343 | 3.38 |
| 1990 | 645,133 | 28,816 | 4.68 | 1,252,834 | 48,134 | 4.00 |
| 1991 | 679,869 | 34,736 | 5.38 | 1,318,342 | 65,508 | 5.23 |
| 1992 | 719,081 | 39,212 | 5.77 | 1,387,398 | 69,056 | 5.24 |
| 1993 | 761,408 | 42,327 | 5.89 | 1,456,930 | 69,532 | 5.01 |
| 1994 | 817,688 | 56,280 | 7.39 | 1,531,102 | 74,172 | 5.09 |
| 1995 | 885,169 | 67,481 | 8.25 | 1,620,916 | 89,814 | 5.87 |
| 1996 | 950,388 | 65,219 | 7.37 | 1,720,818 | 99,902 | 6.16 |
| 1997 | 1,018,271 | 67,883 | 7.14 | 1,814,219 | 93,401 | 5.43 |
| 1998 | 1,056,039 | 37,768 | 3.71 | 1,858,769 | 44,550 | 2.46 |
| 1999 | 1,092,595 | 36,556 | 3.46 | 1,903,119 | 44,350 | 2.39 |
| 2000 | 1,127,829 | 35,234 | 3.22 | 1,947,195 | 44,076 | 2.32 |
| 2001 | 1,163,170 | 35,341 | 3.13 | 1,991,357 | 44,162 | 2.27 |
| 2002 | 1,198,617 | 35,447 | 3.05 | 2,035,991 | 44,634 | 2.24 |
| 2003 | 1,234,166 | 35,549 | 2.97 | 2,081,056 | 45,065 | 2.21 |
| 2004 | 1,269,814 | 35,648 | 2.89 | 2,126,516 | 45,460 | 2.18 |
| 2005 | 1,305,570 | 35,756 | 2.82 | 2,172,351 | 45,835 | 2.16 |
| 2006 | 1,341,475 | 35,905 | 2.75 | 2,218,587 | 46,236 | 2.13 |
| 2007 | 1,377,597 | 36,122 | 2.69 | 2,265,288 | 46,701 | 2.10 |
| 2008 | 1,416,563 | 38,966 | 2.83 | 2,312,536 | 47,248 | 2.09 |
| 2009 | 1,461,252 | 44,689 | 3.15 | 2,360,400 | 47,864 | 2.07 |
| 2010 | 1,509,928 | 48,676 | 3.33 | 2,408,929 | 48,529 | 2.06 |
[1] https://www.gov.il/en/Departments/General/the-israeli-palestinian-interim-agreement-annex-i – The Israeli–Palestinian Interim Agreement, Annex I
[2] https://www.gov.il/en/Departments/General/the-israeli-palestinian-interim-agreement – The Israeli–Palestinian Interim Agreement
[3] We note that this agreement adds 9,000 further police for Gaza; and since among the previous 9,000 there were 7,000 returnees as against 2,000 locals, apparently the same ratio is retained.
[4] https://www.dcaf.ch/sites/default/files/publications/documents/Entry-Points%28EN%29.pdf – Entry-points to Palestinian Security Sector Reform. Roland Friedrich, Arnold Luethold
[5] https://stabilityjournal.org/articles/10.5334/sta.gi – The Evolution and Reform of Palestinian Security Forces 1993–2013. Authors: Alaa Tartir
[6] https://www.nytimes.com/1985/08/18/magazine/the-plo-in-exile.html – The P.L.O. in Exile, by Judith Miller Aug. 18, 1985
[7] Ibid
[8] https://www.pcpsr.org/en/node/267 – Old Guard, Young Guard: the Palestinian Authority and the Peace Process at Crossroads
[9] World Population Prospects: The 2012 Revision
https://population.un.org/wpp/publications/Files/WPP2012_Volume-I_Comprehensive-Tables.pdf
[10] Ibid, p. xi/13, footnote 12
[11] Ibid, p. 172/196. The difference was calculated according to a general population table at the point of the census.
[12] Independent calculation of the difference and change in population, based on data from the US Census Bureau –
https://www.census.gov/data-tools/demo/idb/#/dashboard?COUNTRY_YEAR=2023&COUNTRY_YR_ANIM=2023&CCODE_SINGLE=XG&CCODE=XG&menu=countryViz,
